Two charts. One edge. Built in-house.
A proprietary charting library powered by our own indicators — calculated live on our servers, tuned specifically for crypto. No third-party tools, no on-chain delays, no lag behind price.
Architecture
Proprietary library
Data
Live · every second
Focus
Built for crypto
Osiris Chart
Chart
Live · Osiris Chart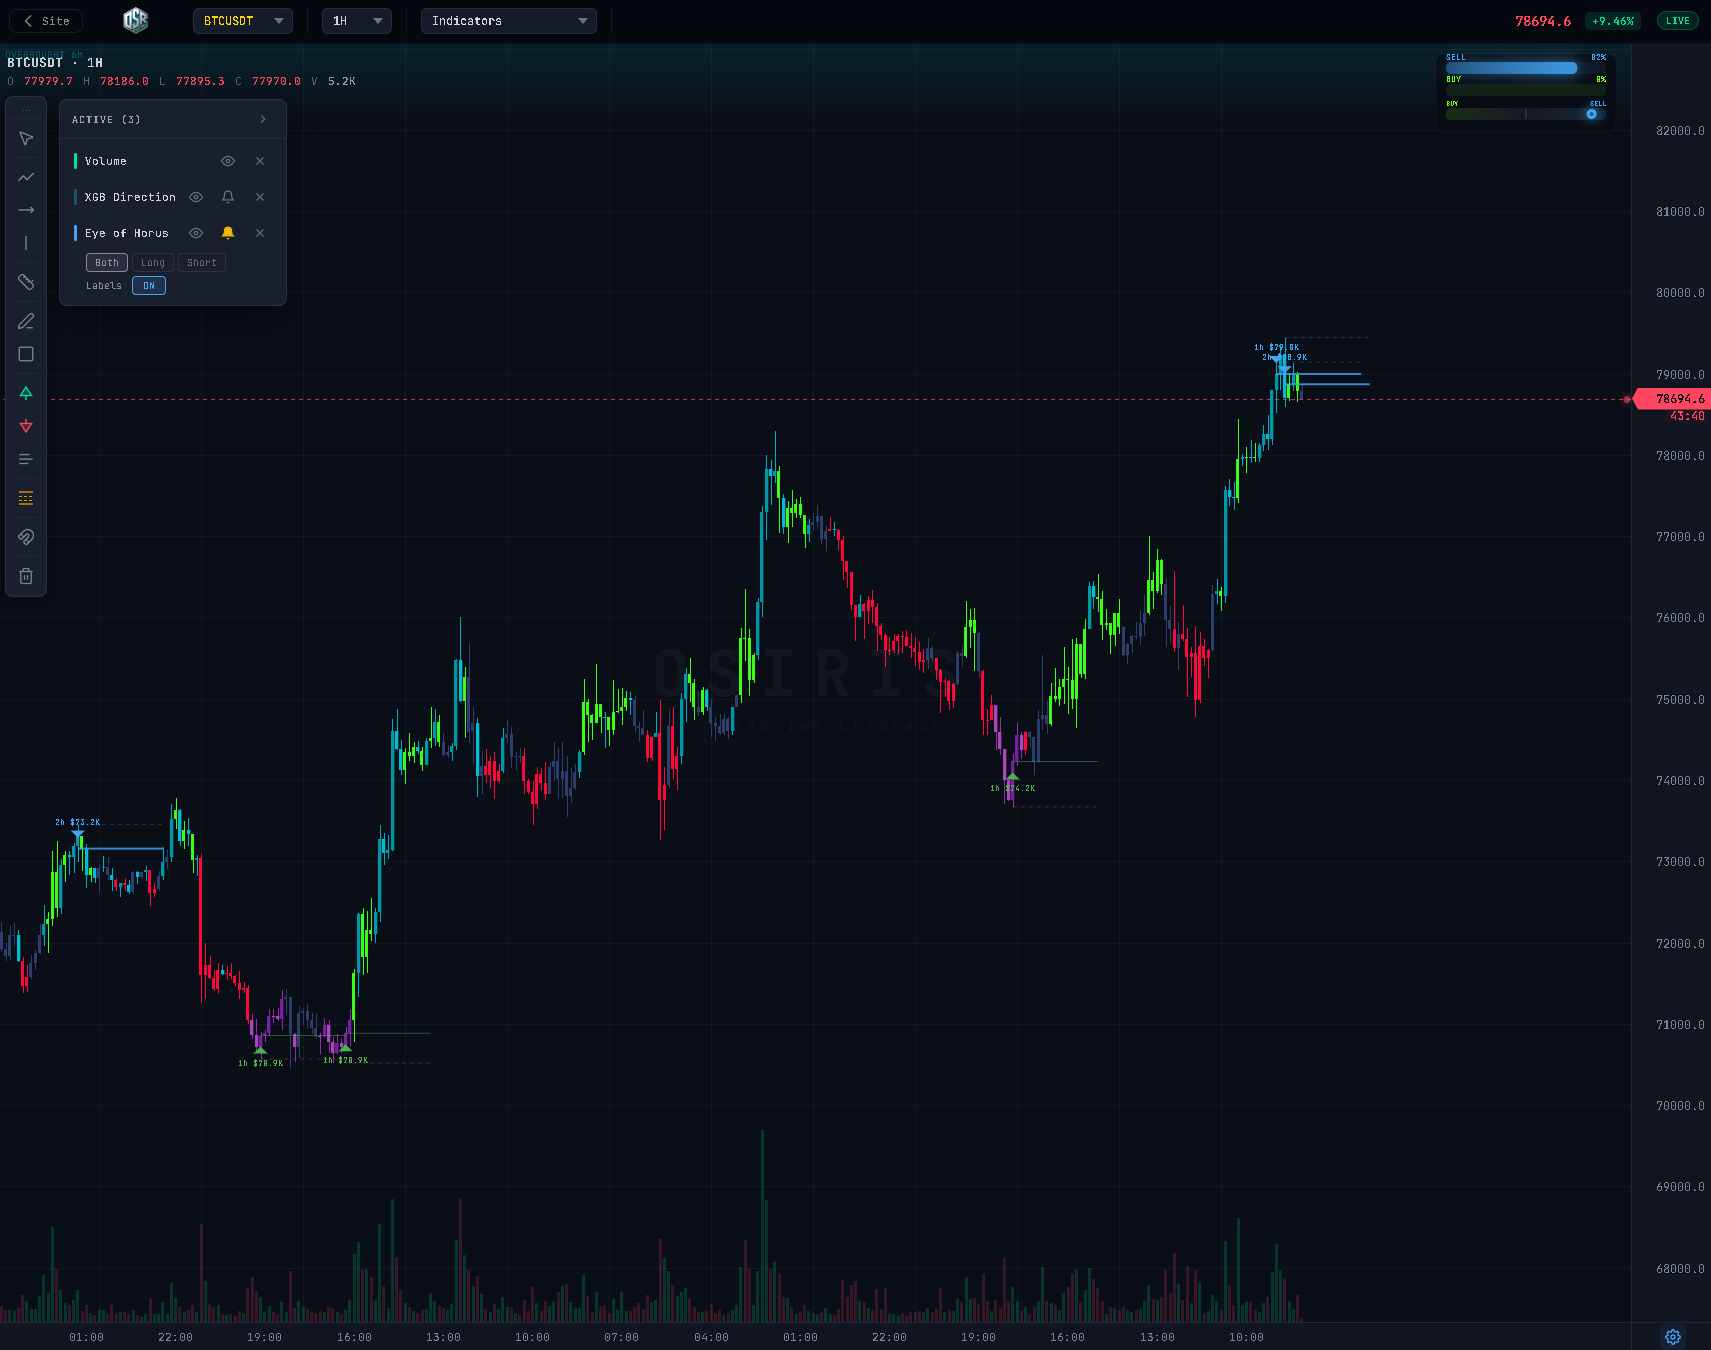
Charting,
engineered— not licensed from elsewhere.
Every indicator calculated on our own server, in real time. Not pulled from third parties. Built from the ground up, tuned for crypto.
- Proprietary indicators — every line, zone, signal built in-house
- Real-time engine — processed the instant each candle closes
- Any timeframe — 1 minute to monthly
- Telegram alerts — bell on every supported indicator
- Drawing tools — trendlines, fibonacci, horizontal, measure
Xcharts
Xcharts
Live · Institutional Flow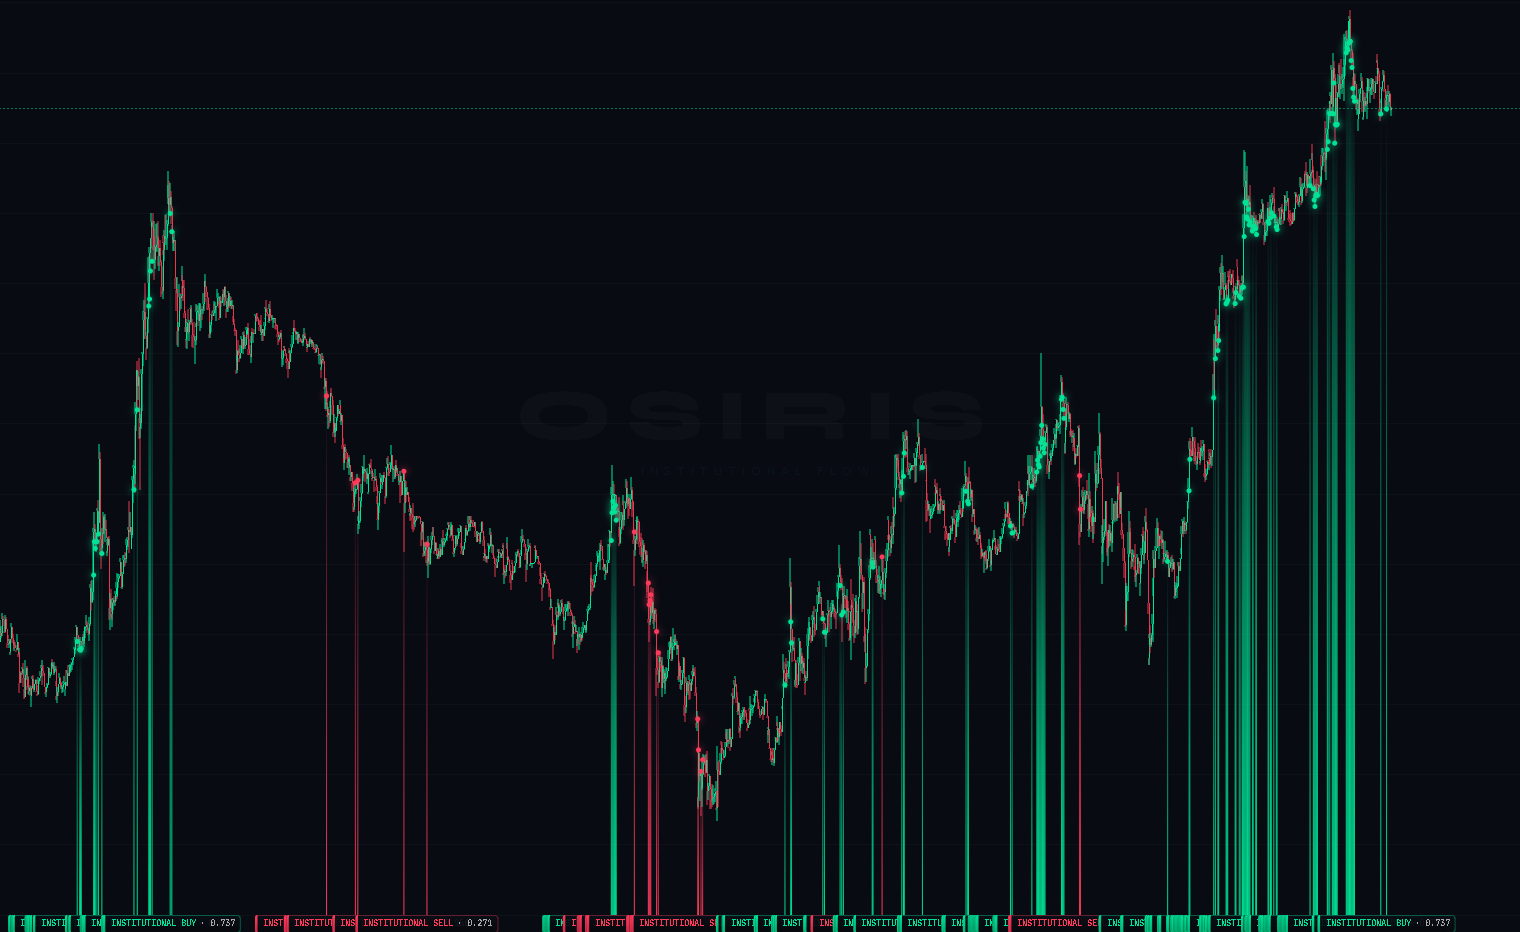
See what
moves the market— before it moves.
A specialized 5-minute BTCUSDT chart focused on detecting institutional activity — whale flows, iceberg orders, absorption, and aggressive sweeps.
49
Features / candle
1s
Refresh rate
5m
Timeframe
- 49 features per candle — whale delta, iceberg refills, absorption, sweeps
- Updated every second — streamed live, no polling delay
- Tested algorithm — pattern detection on years of order flow
- One pair, maximum precision — pure BTC focus
The Arsenal
Every indicator, explained
Each tool built in-house and calculated live. Five flagship indicators lead, with specialized tools grouped by what they do.
Flagship
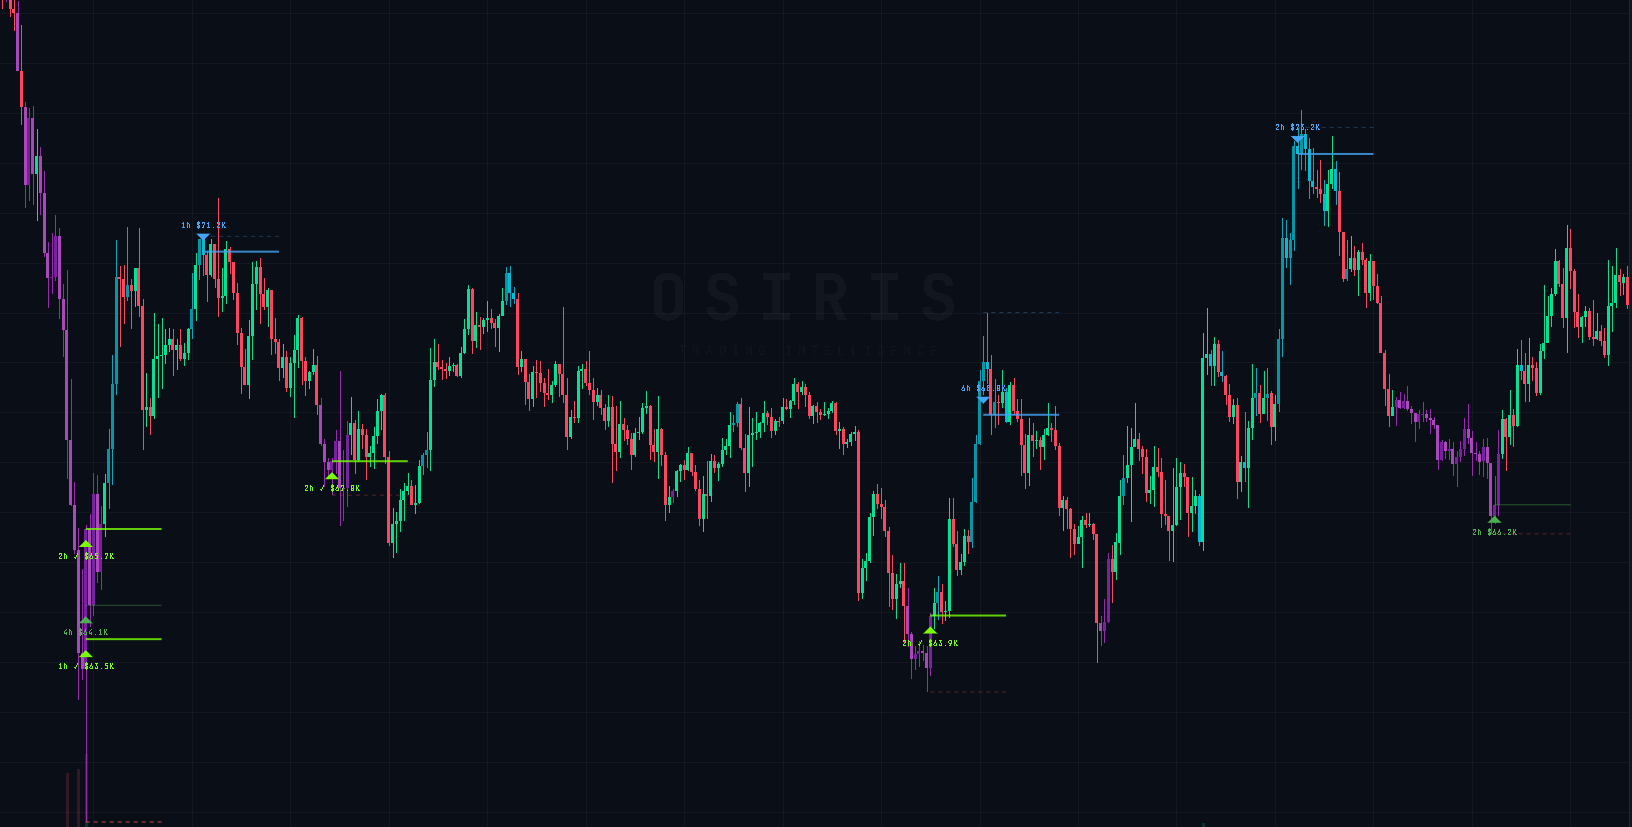
Eye of Horus
Flagship scanner
The all-in-one scanner. Plots entry markers directly on the chart when trend, momentum, volume and volatility all agree. Each signal shows the timeframe it fired on and the exact price — instantly see which timeframes are aligned.
How to use: Signals stacking across multiple timeframes (1h + 2h + 4h) = strongest setups. Single-TF signals = scalps. Works on every pair and every timeframe.
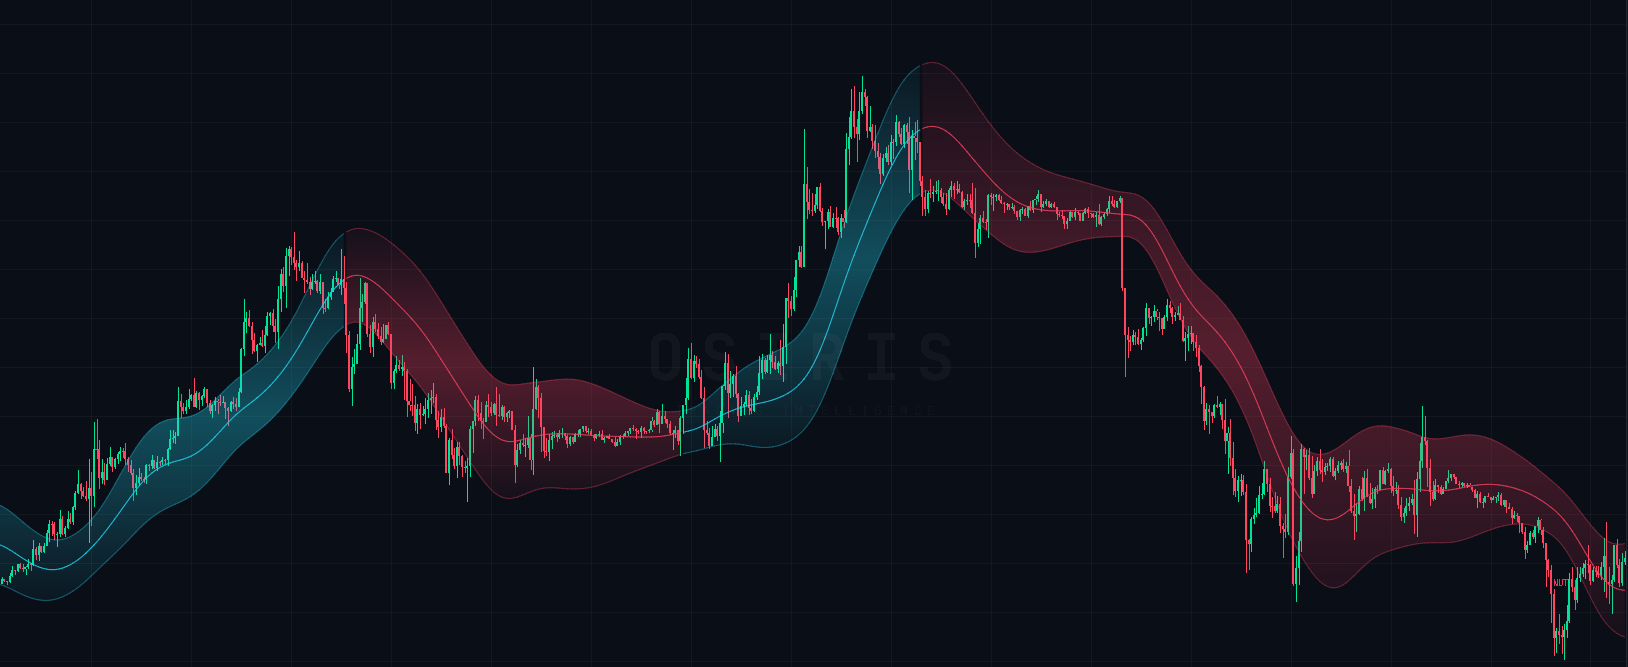
Nut Channel
Trend channel
A dynamic channel that wraps price, showing trend direction with unmistakable clarity. Aqua when market is trending up, rose when trending down. The widening and contracting of the channel shows volatility; the center line acts as dynamic mean reversion.
How to use: Price above the channel = strong uptrend, buy pullbacks to the middle line. Below channel = downtrend, short bounces back to middle. Flat channel = wait or trade the range edges.
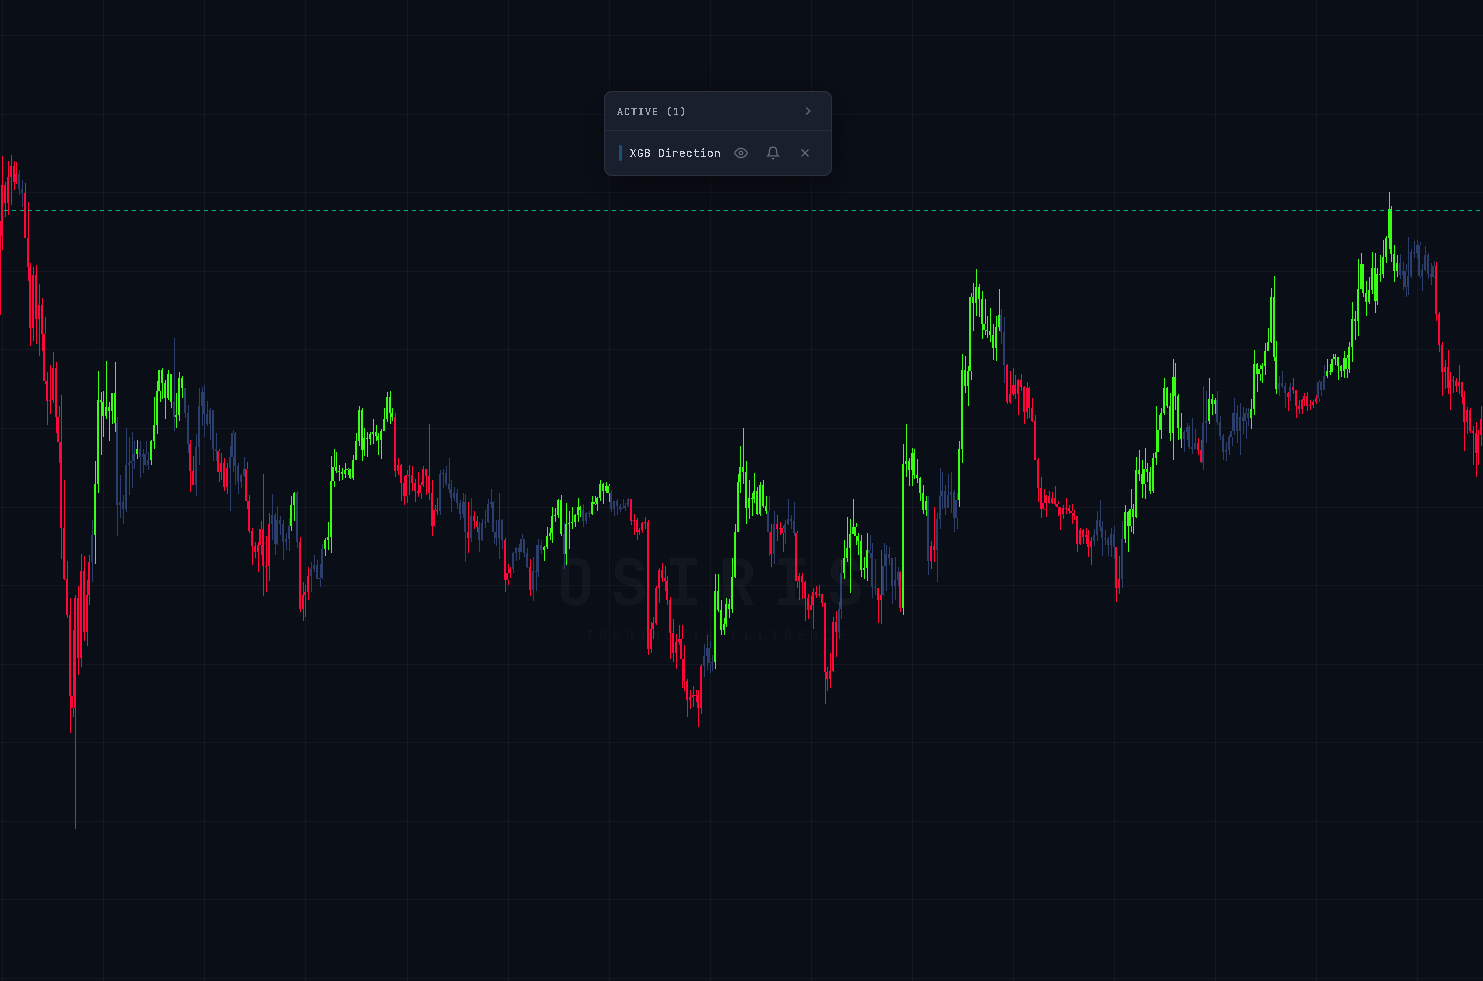
XGB Direction
AI candle coloring · 81% accuracy (backtested)
Colors each candle based on where price is statistically biased to go next. Green = bullish bias, red = bearish bias, blue = no clear direction. Built in-house using years of historical data, calibrated specifically for crypto volatility.
How to use: Long consecutive green or red runs confirm a trend is strong. Blue candles signal it's time to wait, not trade. Works best on 2H and 4H timeframes.
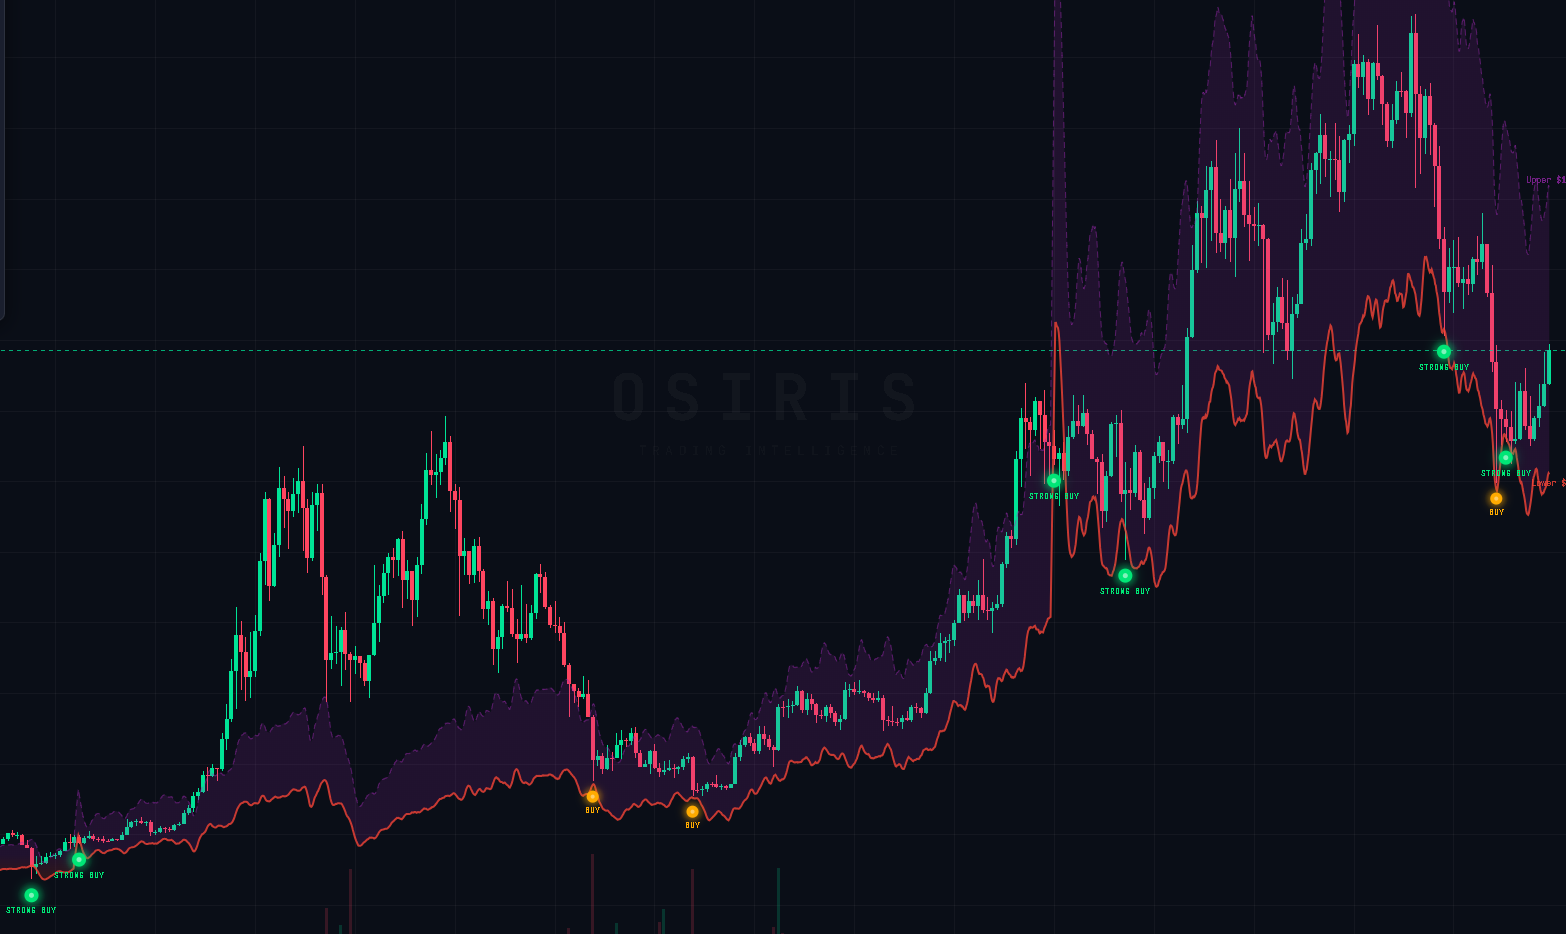
Thoth Bands
Macro floor
Draws two dynamic floor bands under price — a lower band and an upper band representing the fair-value range where Bitcoin has historically found strong buying. Touching the lower band has historically marked every major BTC cycle bottom.
How to use: Green dots = price entering the accumulation range. Orange dots = deep-discount range. Daily+ timeframe for highest signal quality.
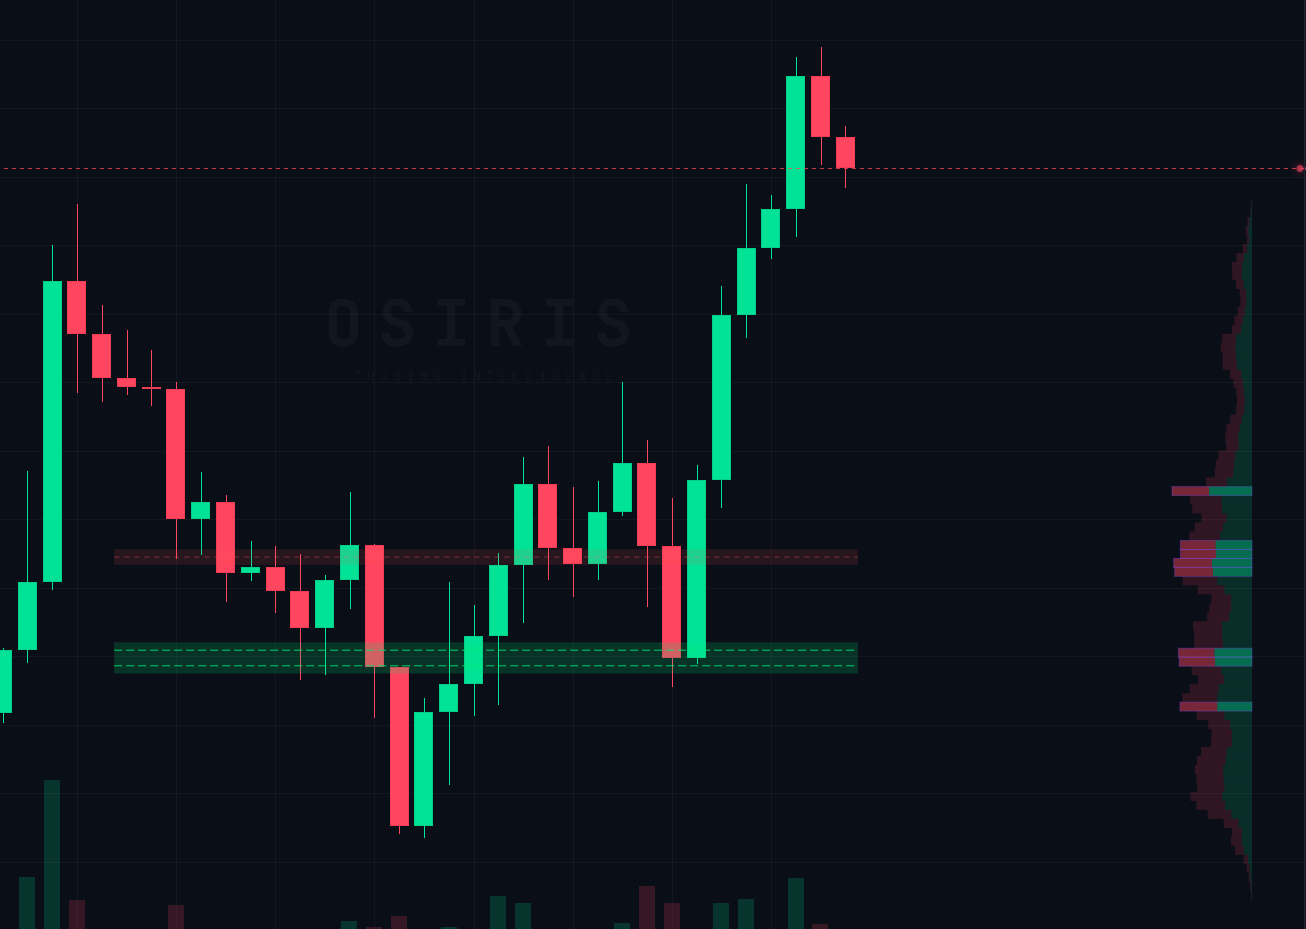
Flow Zones
Volume concentration map
Maps automatically the price zones where the most trading volume has changed hands — the prices institutions actually care about. Horizontal green boxes mark high-volume zones on the chart; the side profile shows volume distribution across every price.
How to use: Price usually reacts when it revisits a high-volume zone — expect bounces or rejections. Thick side-profile bars = heavy liquidity. Thin bars = fast moves and stop hunts.
Essentials
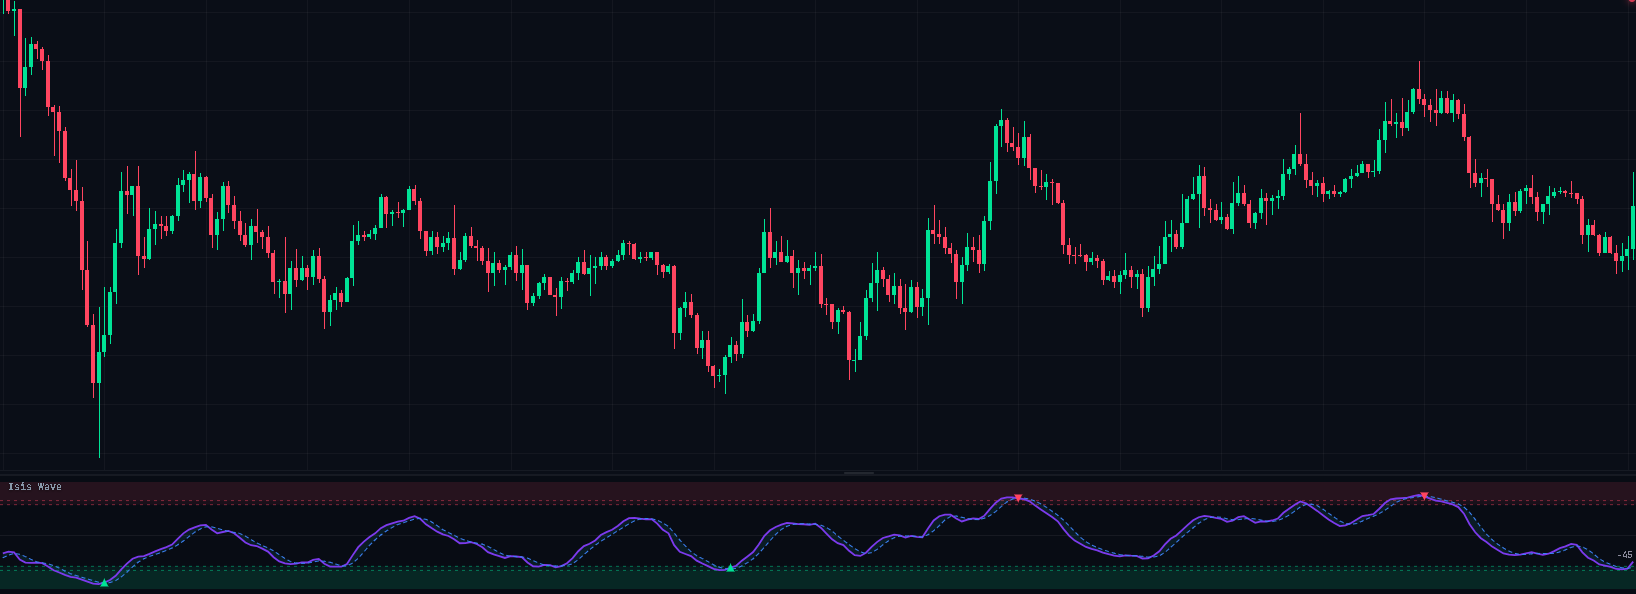
Isis Wave
Momentum oscillator
Two-line momentum oscillator built for crypto swings. Red triangles mark tops, green triangles mark bottoms — the exact moment momentum reverses.
How to use: Green triangles inside oversold = highest-probability long entry. Red triangles inside overbought = short or profit take. Sweet spot on 1H/4H.
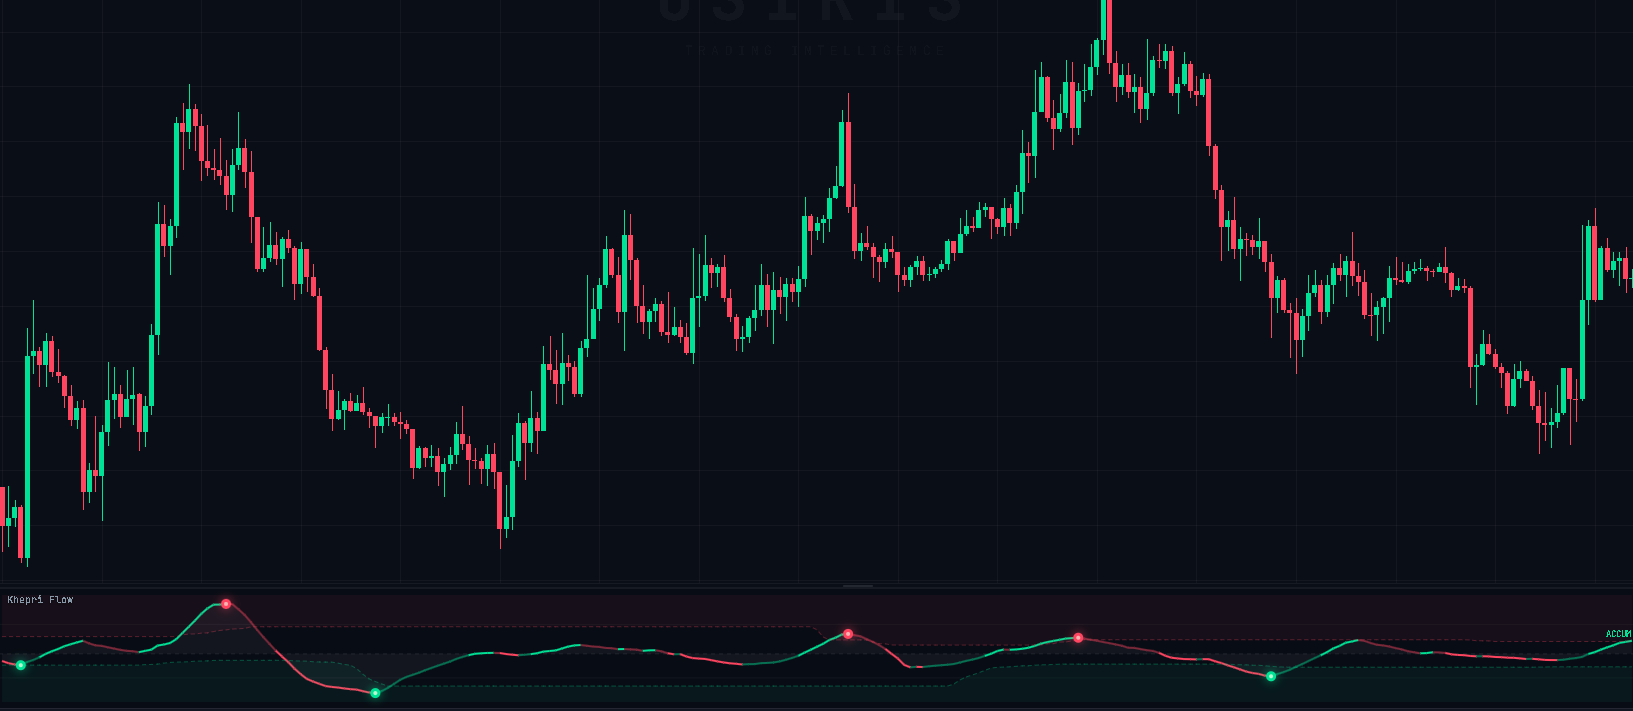
Khepri Flow
Buy vs sell pressure
Tracks the real battle between buyers and sellers. Green dots signal accumulation extremes, red dots signal distribution. DISTRIB label flags when pressure flips.
How to use: Green dots in a downtrend = sellers exhausting, reversal near. Red dots in uptrend = buyer exhaustion, pullback coming.
Complete Arsenal
Specialized tools for specific setups. Click any card for full details.
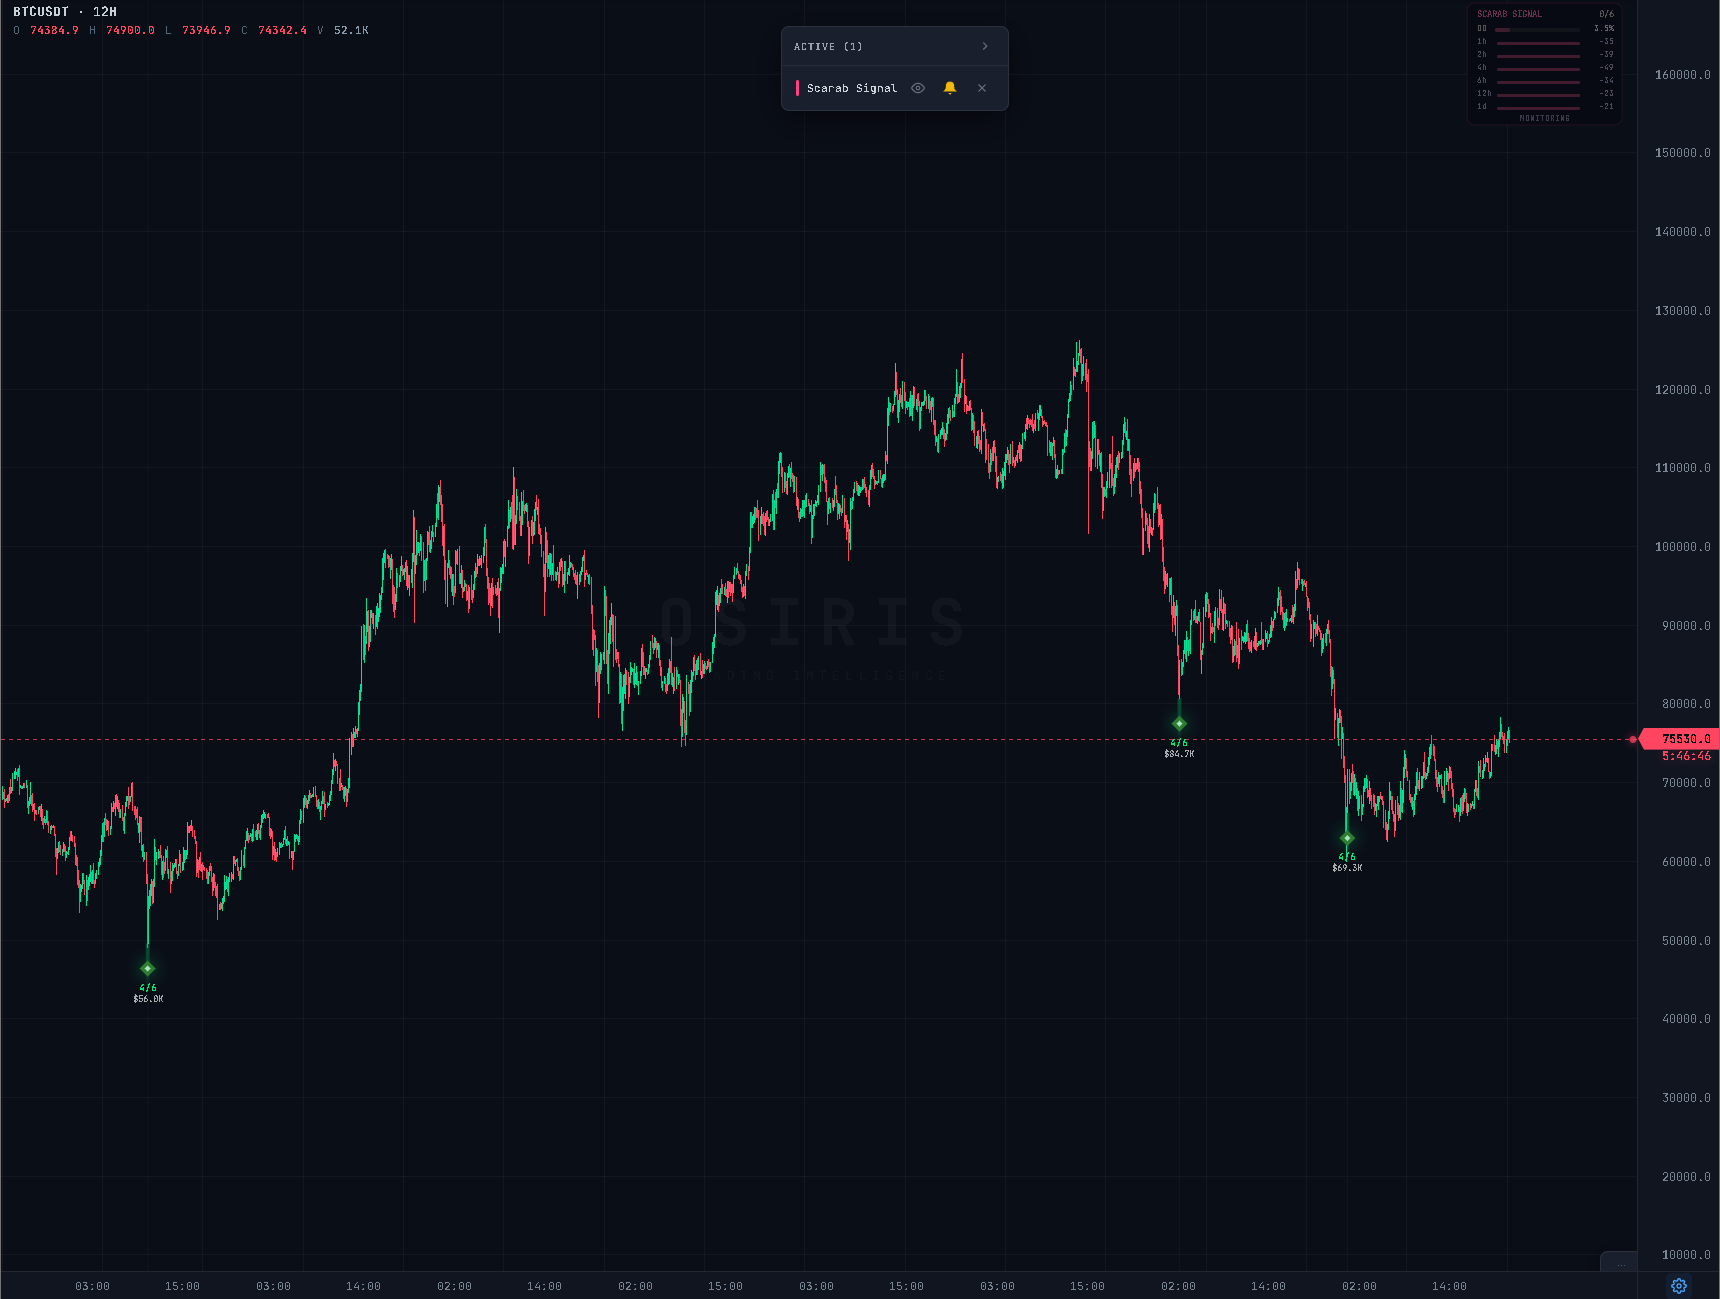
Scarab Signal
Detects the macro bottoms of a full market cycle. Confirms the same bottom signal across 6 different timeframes simultaneously. When all 6 line up, a green diamond marks the exact low.
How to use: A full 6/6 signal fires 2-3 times per cycle — generational buy zones. Partial confluence (3/6-4/6) = bounce likely, not macro low.
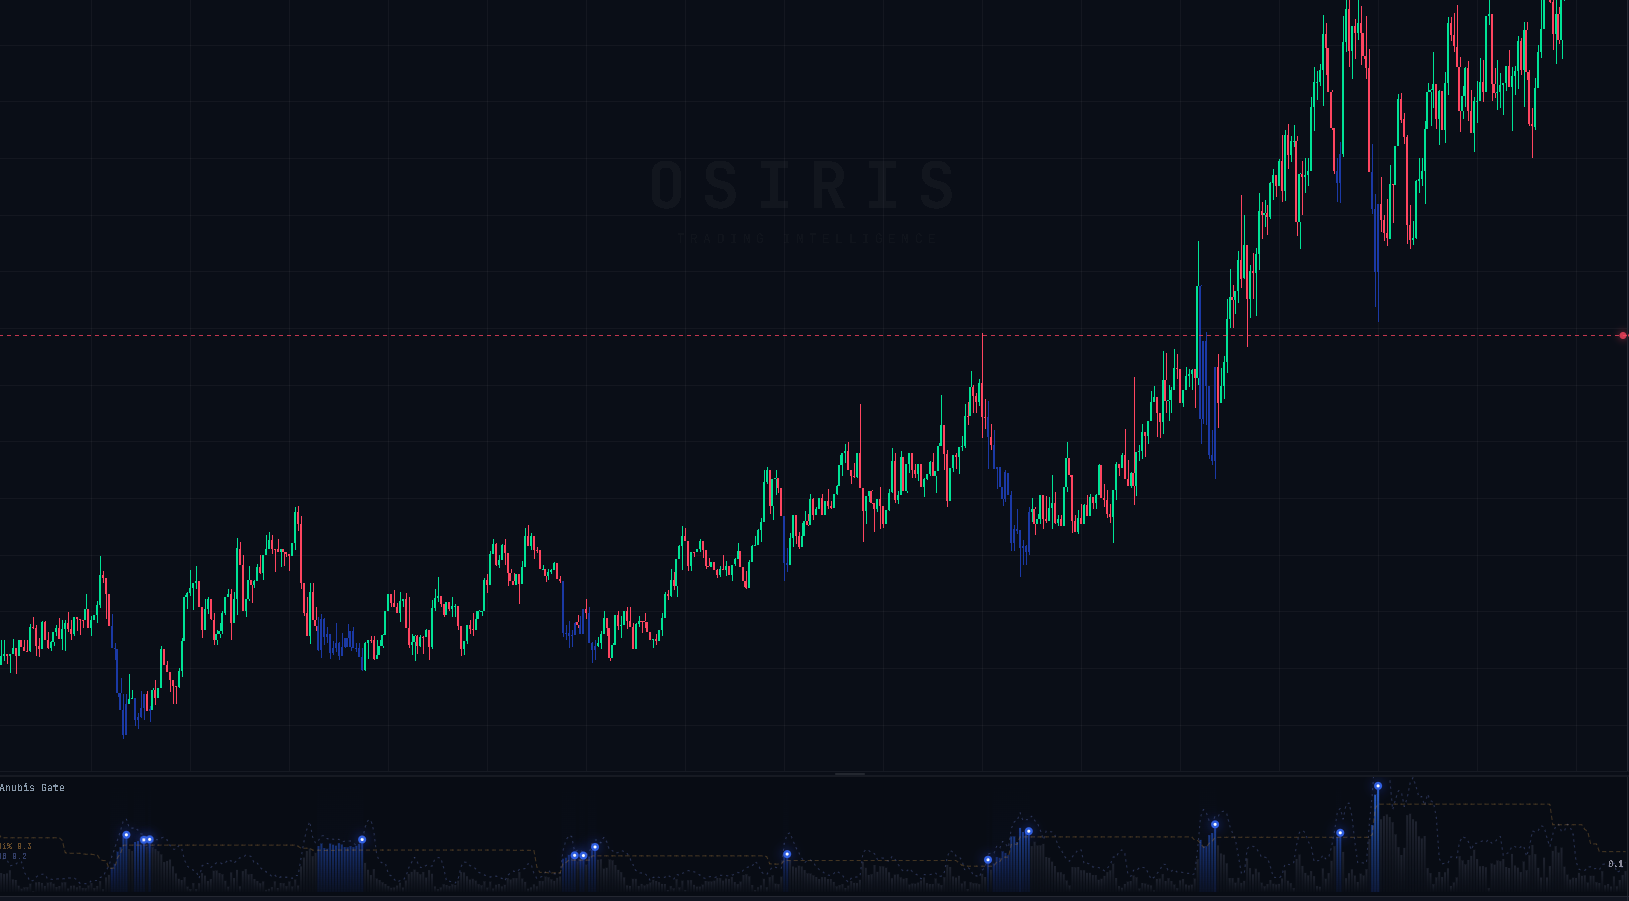
Anubis Gate
Fires when the market is actively capitulating — violent volatility expansion followed by a reversal candle. Rare but historically precise on major lows.
How to use: Green bar + confirmation candle = setup active. Combine with Scarab for generational buys.
Screenshot coming soon
Hash Capitulation
Detects when Bitcoin miners are forced to sell at a loss — historically the strongest buy signal in crypto. SMA30 crosses below SMA60 on hash rate.
How to use: Flashes at every major BTC bottom since 2015. Buy the pullback after the flash, not panic the initial dip.
Screenshot coming soon
Sentiment Indicator
Reads market sentiment as a 0–1 score. Stays high longer than price at tops, stays low longer than price at bottoms. Under 0.15 = depression (aggressive buy zone).
How to use: Combine with Thoth or Scarab for second-spot buys in bear markets. Never standalone.
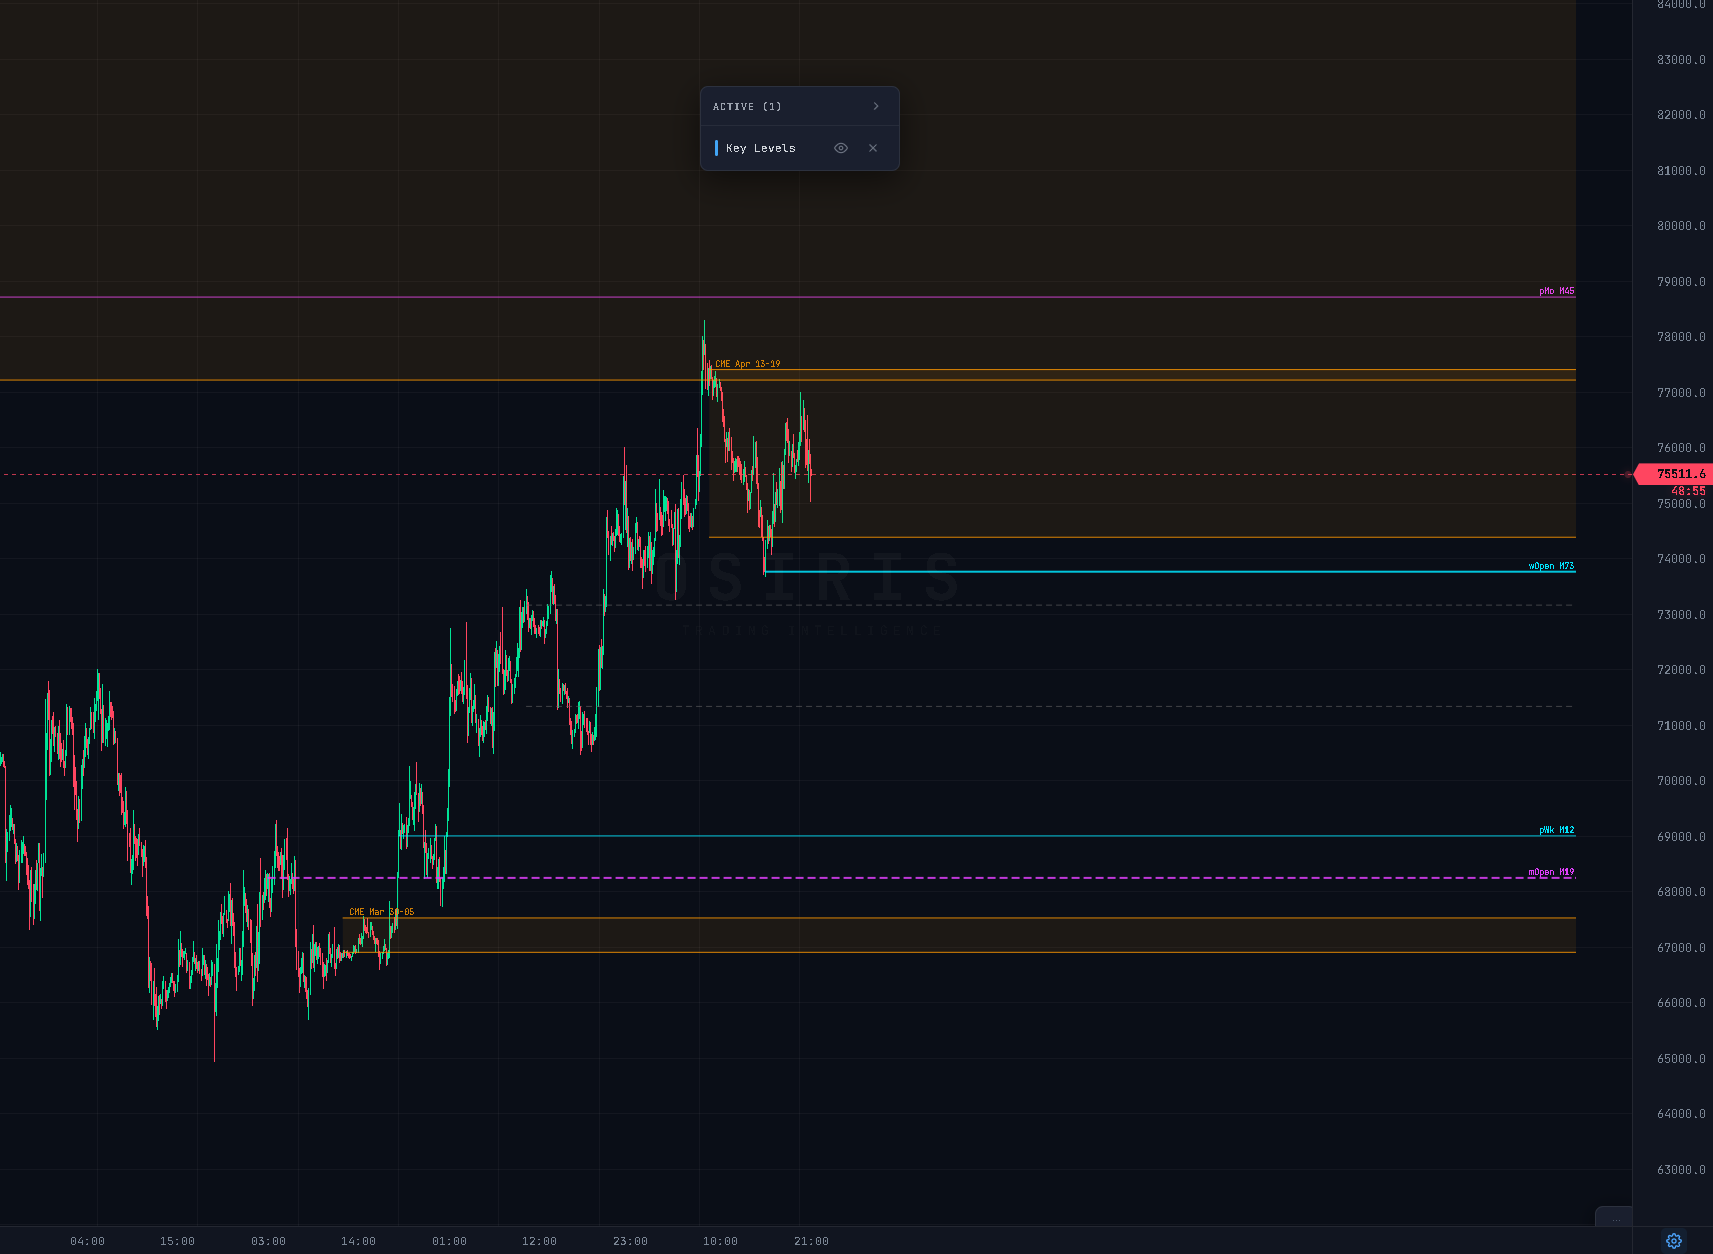
Key Levels
Draws CME gaps, previous week/month highs and lows, and weekly/monthly opens automatically. All server-side, real-time.
How to use: CME gaps act like magnets. Previous week/month highs and lows are first targets in any trend. Weekly/monthly open separates bias.
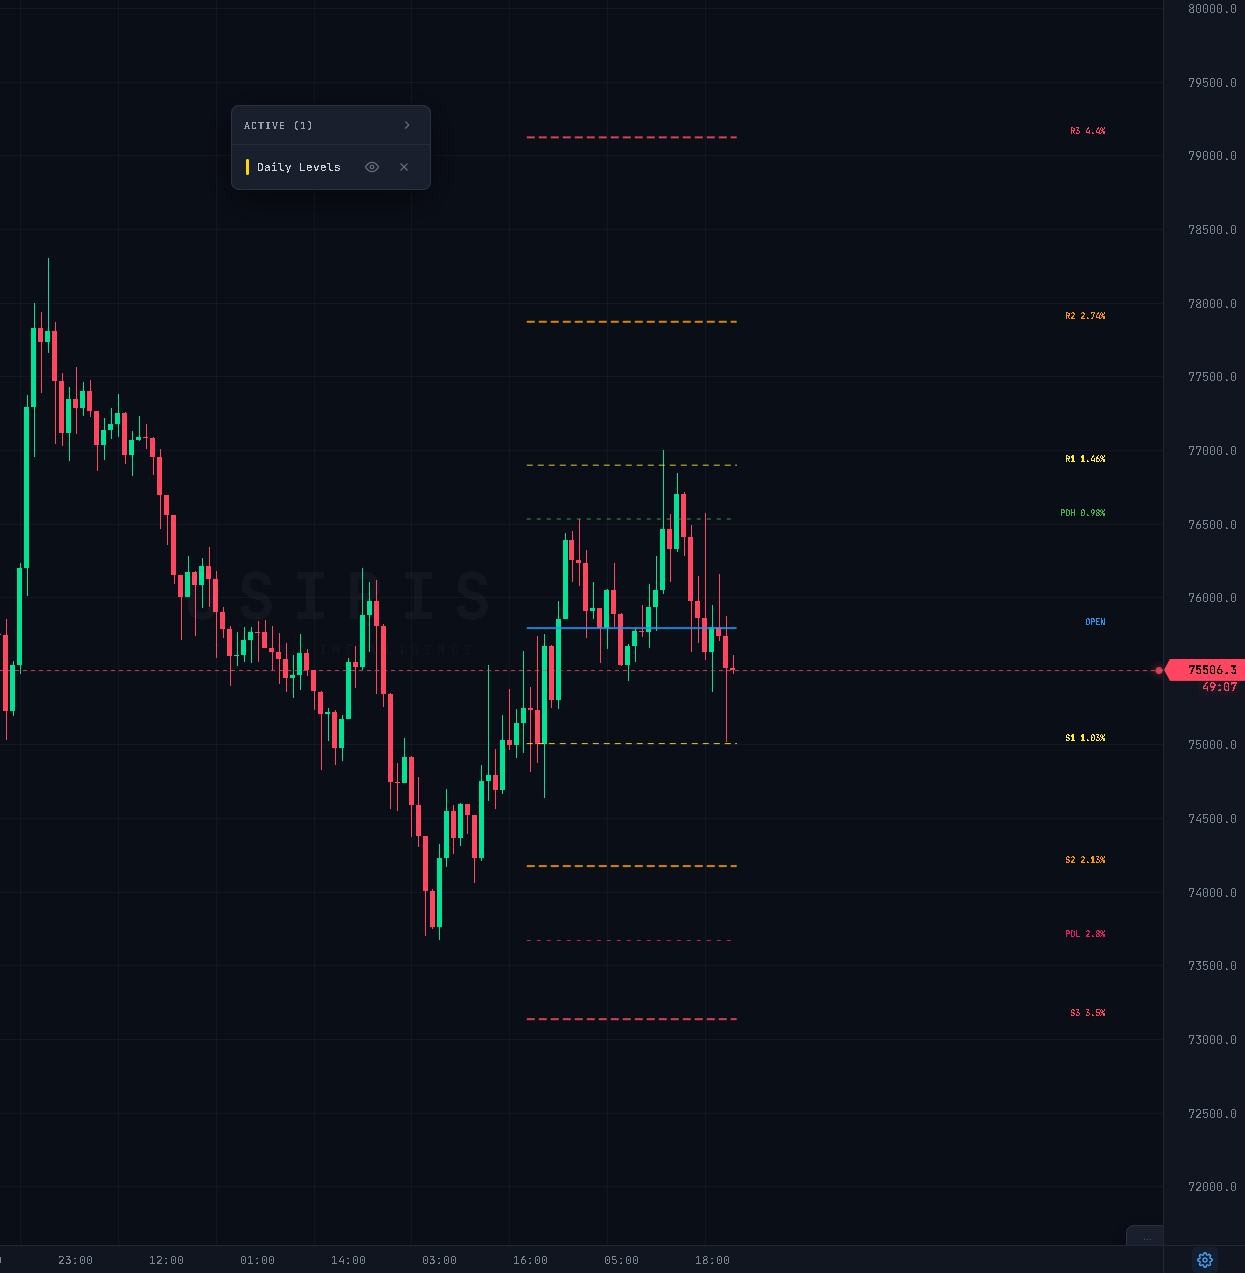
Daily Levels
Three resistance levels (R1, R2, R3) and three support levels (S1, S2, S3) derived from yesterday's action. Previous day high/low + today's open, with % distance.
How to use: R1/S1 = first reaction zones, most frequent intraday targets. Today's open separates bullish/bearish bias.
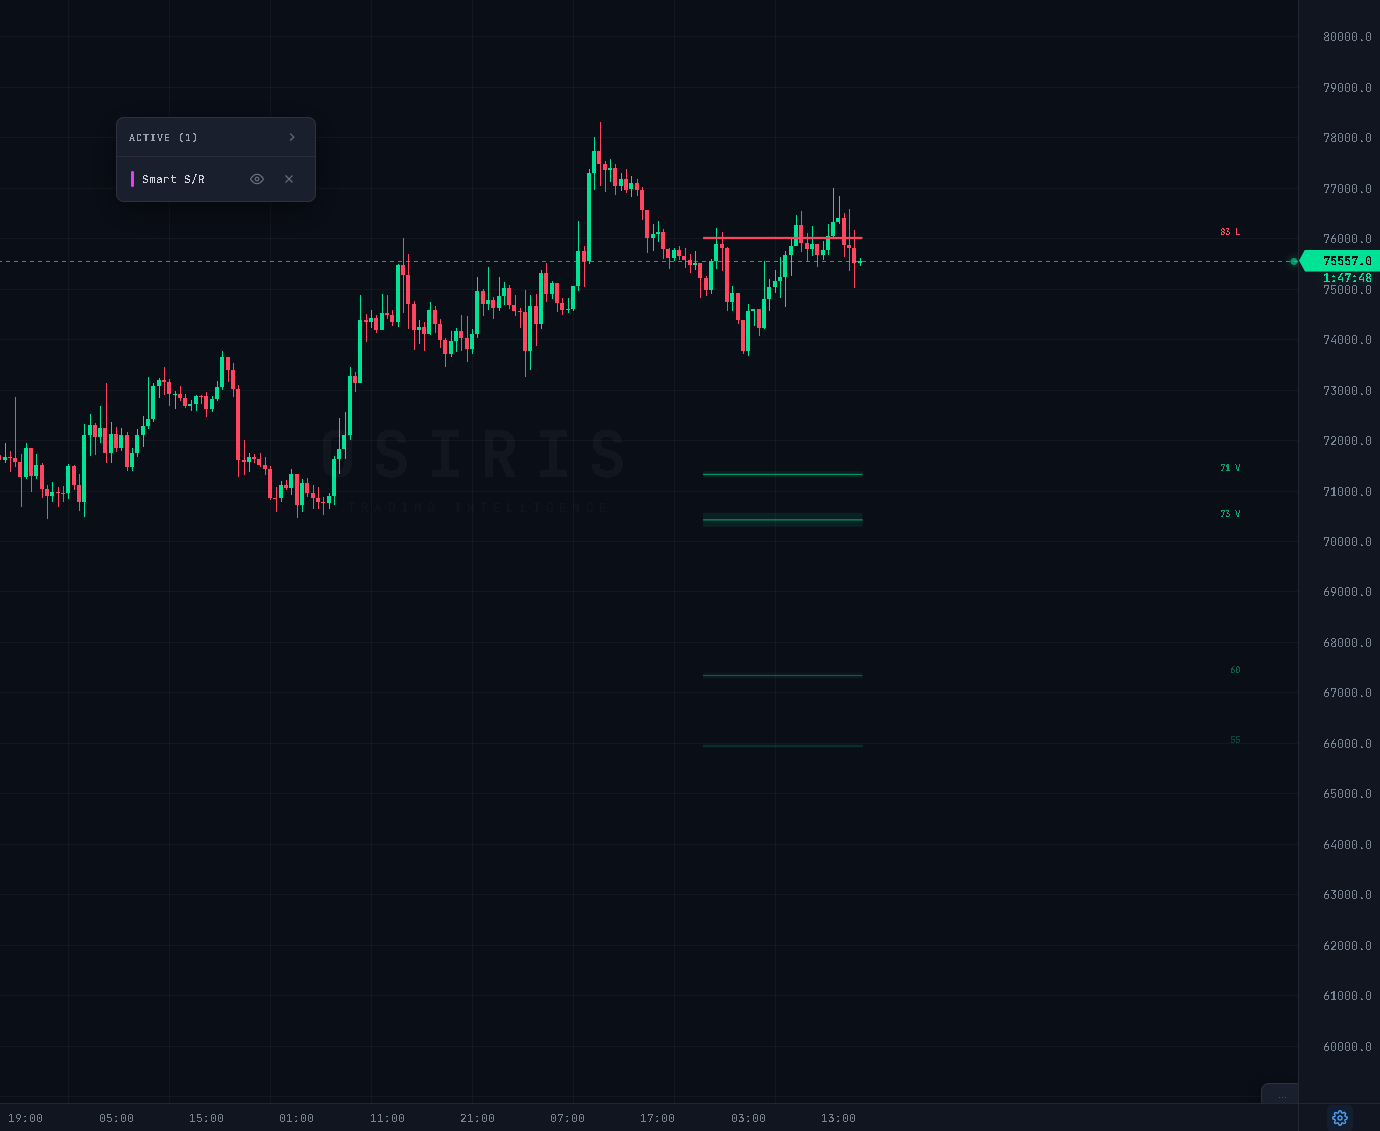
Smart S/R
Scans history and detects the strongest horizontal S/R lines. Each level gets a strength score based on historical reactions — higher score = institutions defending it.
How to use: High-score levels (70+) = expect strong reactions or clean breakouts. Clusters = where price really fights.
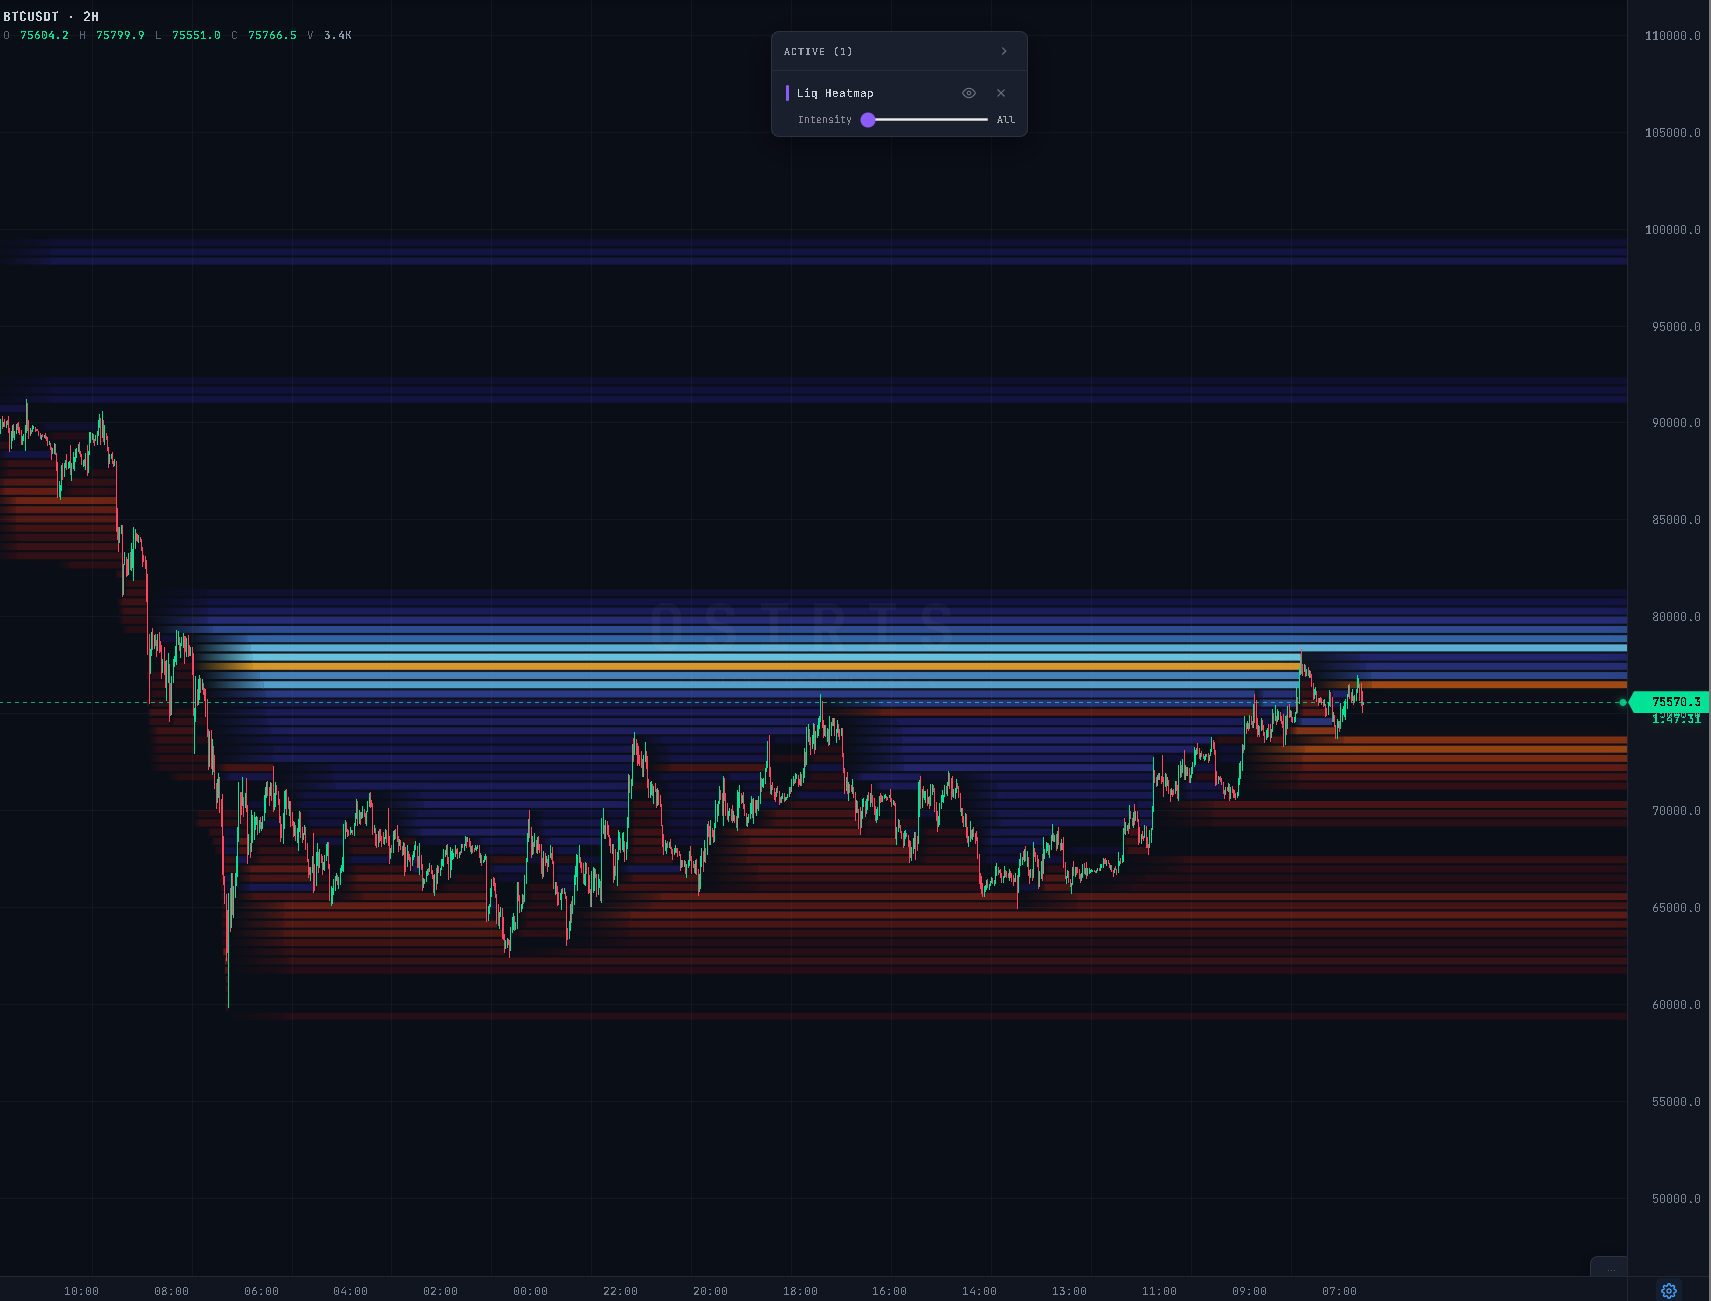
Liquidation Heatmap
Live map of every price level where leveraged positions will get liquidated. Bright yellow/orange = massive cluster, purple/blue = smaller. Price hunts these.
How to use: Bright clusters = magnets. Trade toward nearest bright band = high-probability target.
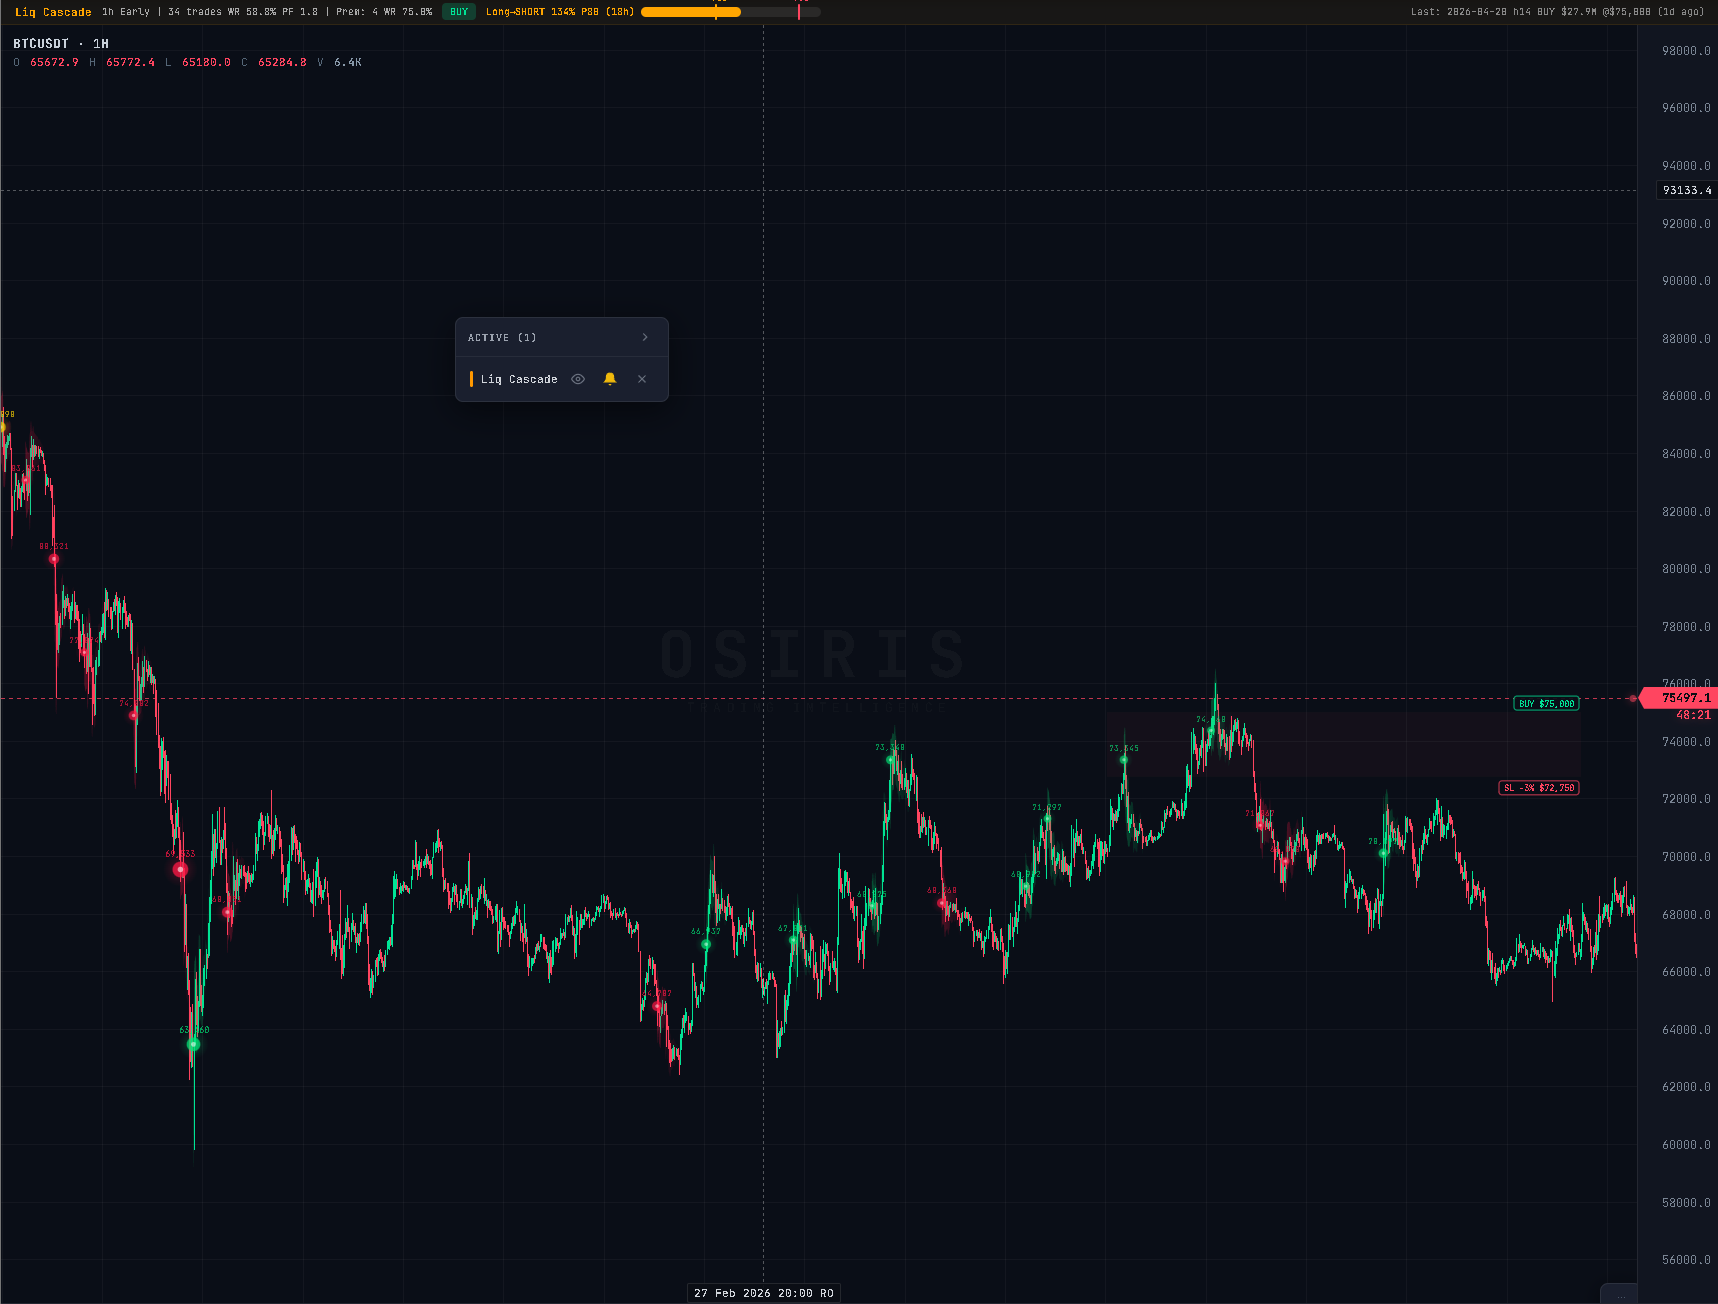
Liq Cascade
Finds levels where a chain-reaction of liquidations will start — the domino effect pushing price much further than normal. Live entry/SL/TP box included.
How to use: Enter direction of cascade before trigger. Other side = target. SL just beyond trigger.
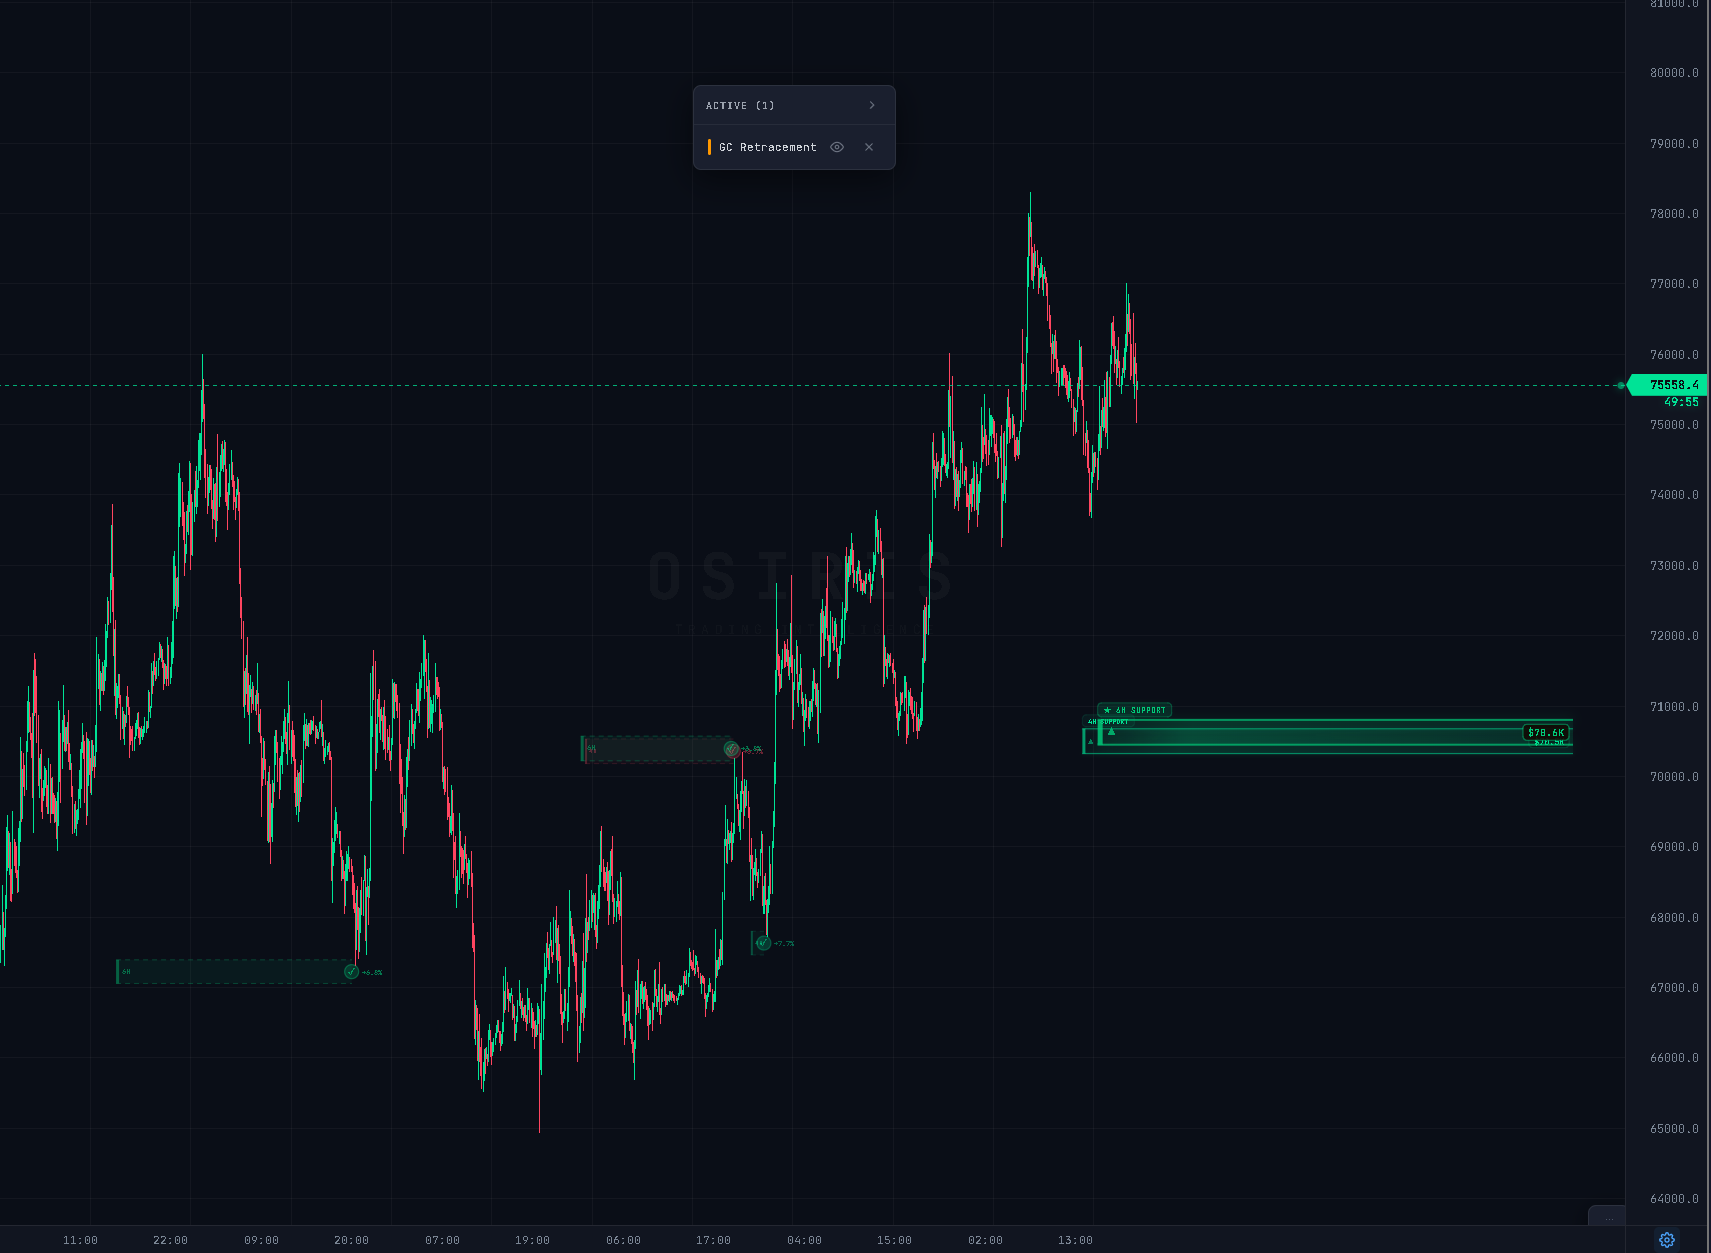
GC Retracement
Detects pullback zones inside active trends — exact price areas where trend is most likely to resume. Each zone labeled with TF and expected move %.
How to use: In uptrend, green zones = buy opportunities. Deeper = better R/R. Higher TF zones priority.
Screenshot coming soon
Edge RSI
RSI tuned for crypto volatility with adaptive thresholds. Catches early divergences before the traditional RSI does.
How to use: Divergences at extremes = reversal setups. Best as confirmation for entries from other tools.
Screenshot coming soon
Exhaustion
Fires when a move is running out of fuel — sequential count of stretched candles in the same direction. Precedes reversals or extended consolidations.
How to use: Count ≥ 9 = trend tired, don't chase. Count + divergence + level = high-probability reversal.
Screenshot coming soon
Volume
Clean volume display with moving average. Confirms breakouts, spots exhaustion and absorption.
How to use: Breakouts on high volume hold. Low-volume breakouts fail. Volume spikes at highs/lows = exhaustion.
Ready to see them live?
Start free with Shrimp · 6 indicators unlocked · No card required.
View Plans